A very strong El Niño is developing rapidly across the tropical Pacific—and it could become one of the defining climate signals of fall 2026 and early winter.
But there is an important distinction: El Niño changes the odds; it does not determine the weather everywhere.
The Pacific is sending a powerful signal
The traditional Niño 3.4 index measures sea-surface temperature (SST) anomalies averaged over 5°S–5°N and 170°W–120°W. During 2026, the index has strengthened rapidly across seasonal, monthly, and weekly timescales.
The seasonal Niño 3.4 anomaly averaged +1.51°C during May–July 2026, while the July monthly value reached +2.03°C.
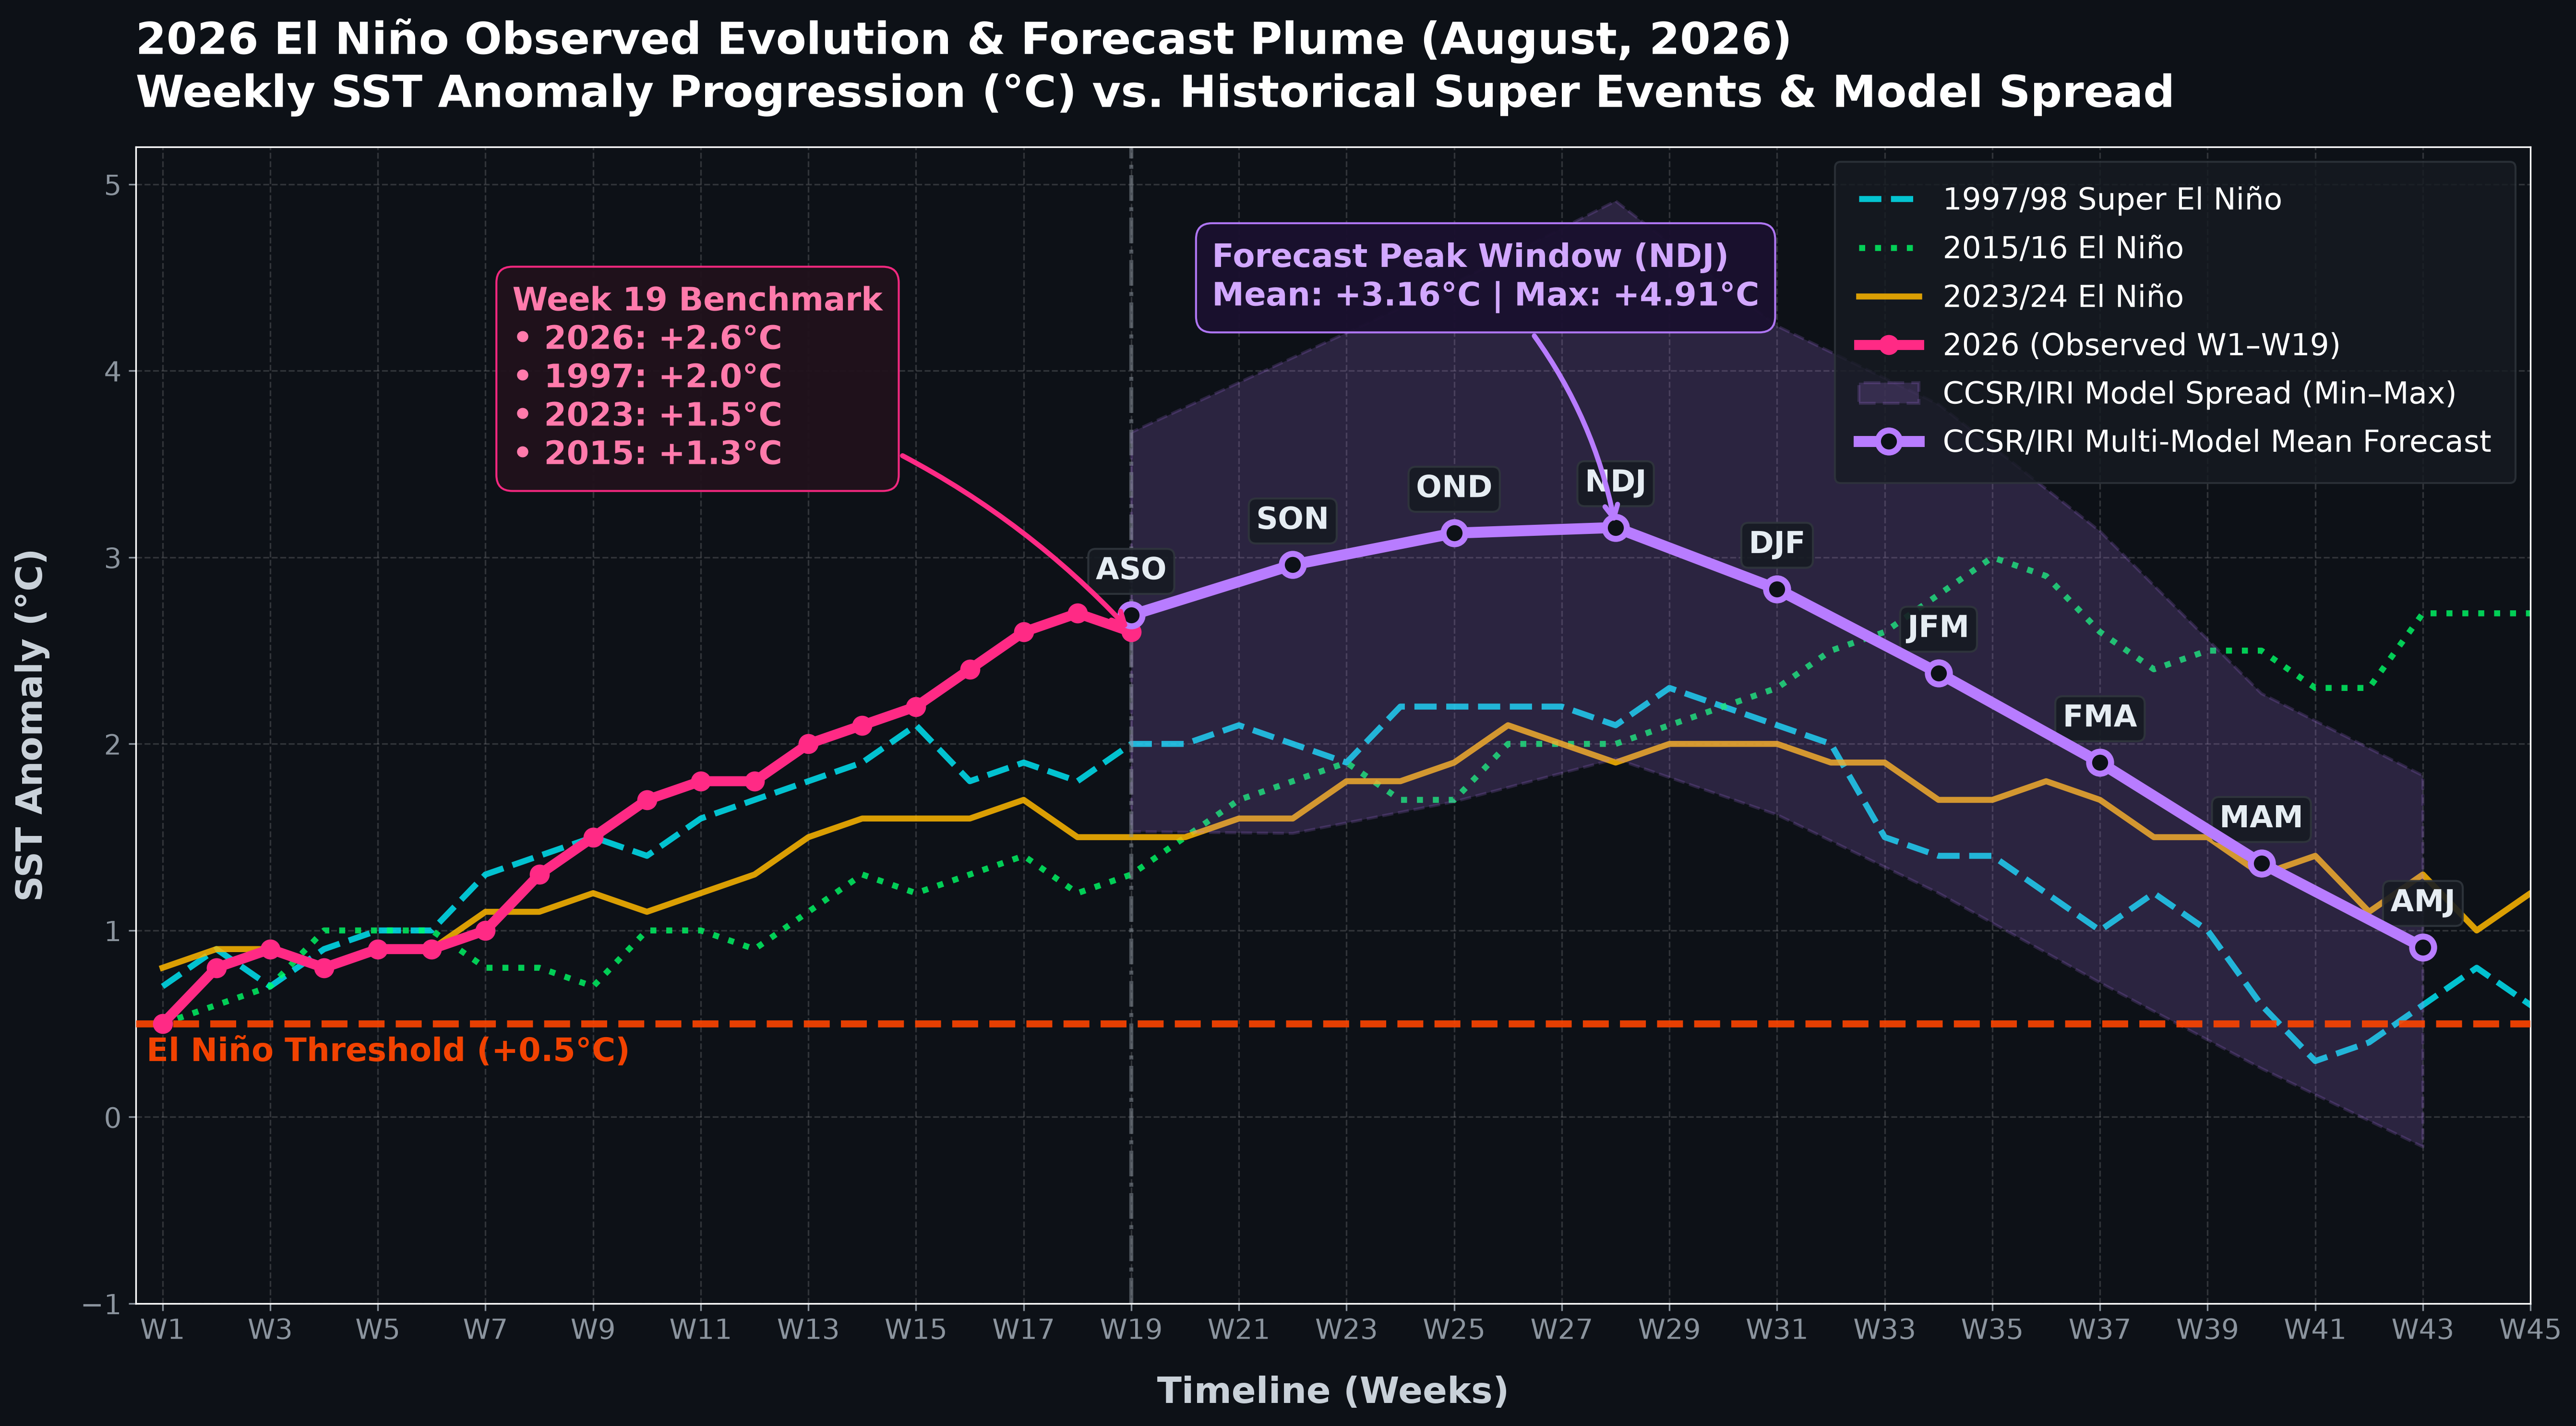
Figure 1. Observed and forecast Niño 3.4 index showing the rapid strengthening of the 2026 El Niño.
Source: NOAA OISST v2.1 observations and CCSR/IRI August 2026 ENSO forecast.
The pink line in Figure 1 shows the weekly observations. Values have remained above +2°C through recent weeks, with the latest reaching approximately +2.6°C. The persistence of the signal is notable: this is not a single spike, but a sustained period of exceptionally warm conditions.
The purple line shows the average Niño 3.4 forecast from all 26 CCSR/IRI models, extending from ASO through AMJ. The purple shading shows the spread across the models, illustrating the range of possible forecast intensities.
The ensemble mean peaks at about +3.16°C during NDJ, highlighting the exceptional strength of the forecast event.
This reinforces the signal discussed in our earlier “A +3°C El Niño? The ENSO Forecast Is Getting Interesting” update.
But the significance of such a strong signal goes beyond the number itself. A strong and persistent forecast signal can provide governments, agencies, organizations, and communities with a valuable window of opportunity to prepare before impacts occur.
This is where Earth Information for Society matters. Seasonal information cannot tell us exactly what will happen in a particular place. But when the signal is strong, it can support anticipatory action—from reviewing preparedness plans and allocating resources to adjusting operations before elevated climate risks materialize.
What does El Niño typically do to the United States?
El Niño begins thousands of miles away, but its influence can reach deep into North America. Changes in tropical Pacific rainfall and convection can alter large-scale atmospheric circulation, including the jet stream and storm tracks.
The historical record provides a useful baseline.
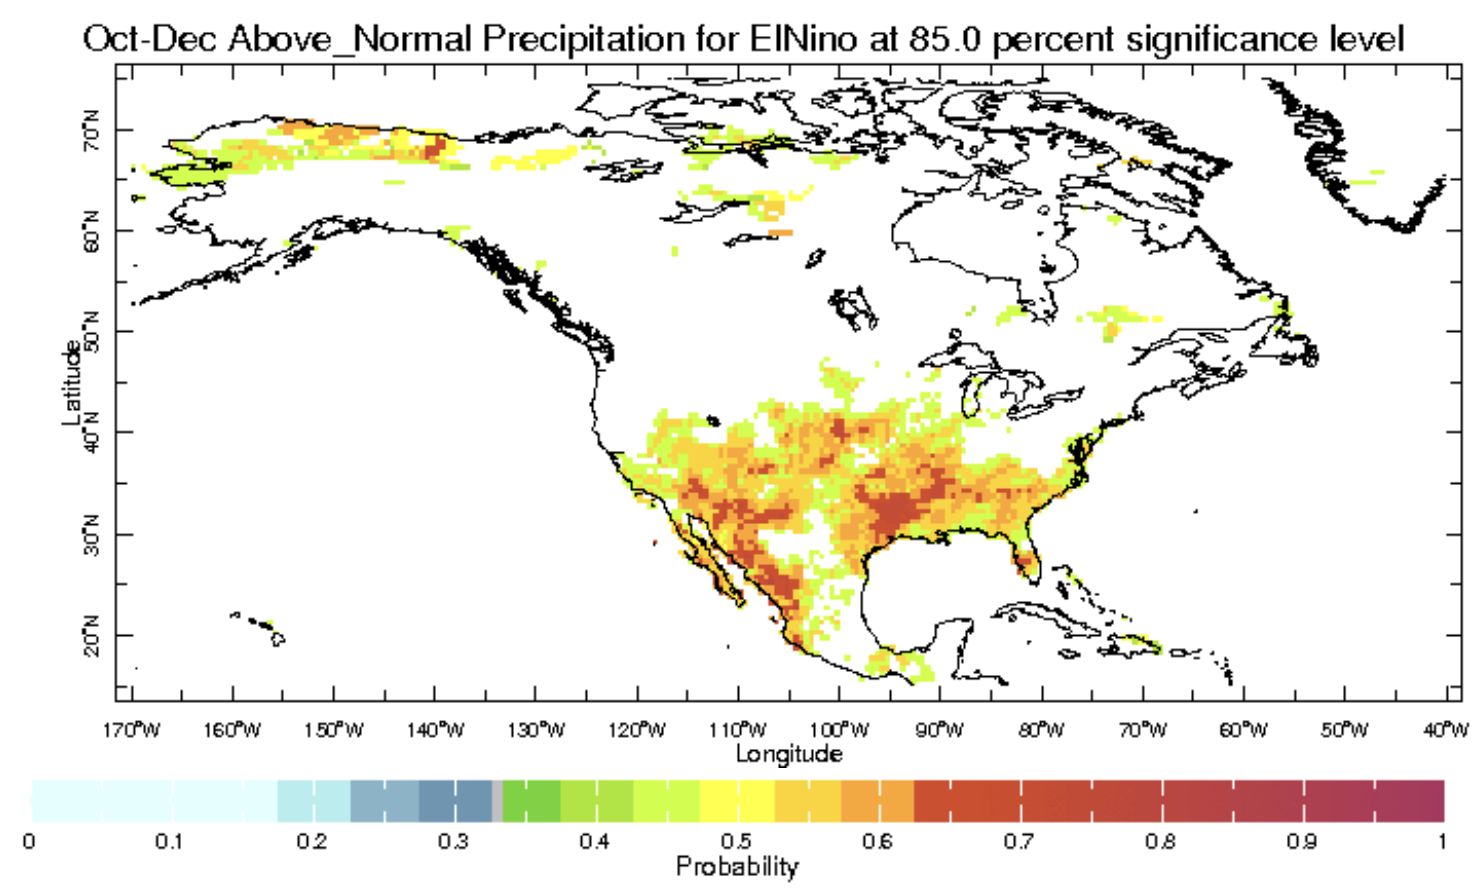
Figure 2. Conditional probability of above-normal precipitation during October–December under El Niño conditions.
Source: IRI Data Library — ENSO Climate Impacts.
Figure 2 shows how the probability of above-normal precipitation changes when El Niño conditions are present. It is a conditional probability, not a guarantee of rainfall.
During October–December, El Niño has historically increased the likelihood of wetter-than-normal conditions across parts of the southern United States, while some northern areas have more often experienced drier conditions.
But this is a tendency—not a guarantee.
Every El Niño is different. Pacific warming, tropical convection, the jet stream, storm-track position, and other climate patterns can modify the eventual U.S. response.
What are we expecting in OND 2026?
This is where the historical record meets the current forecast.
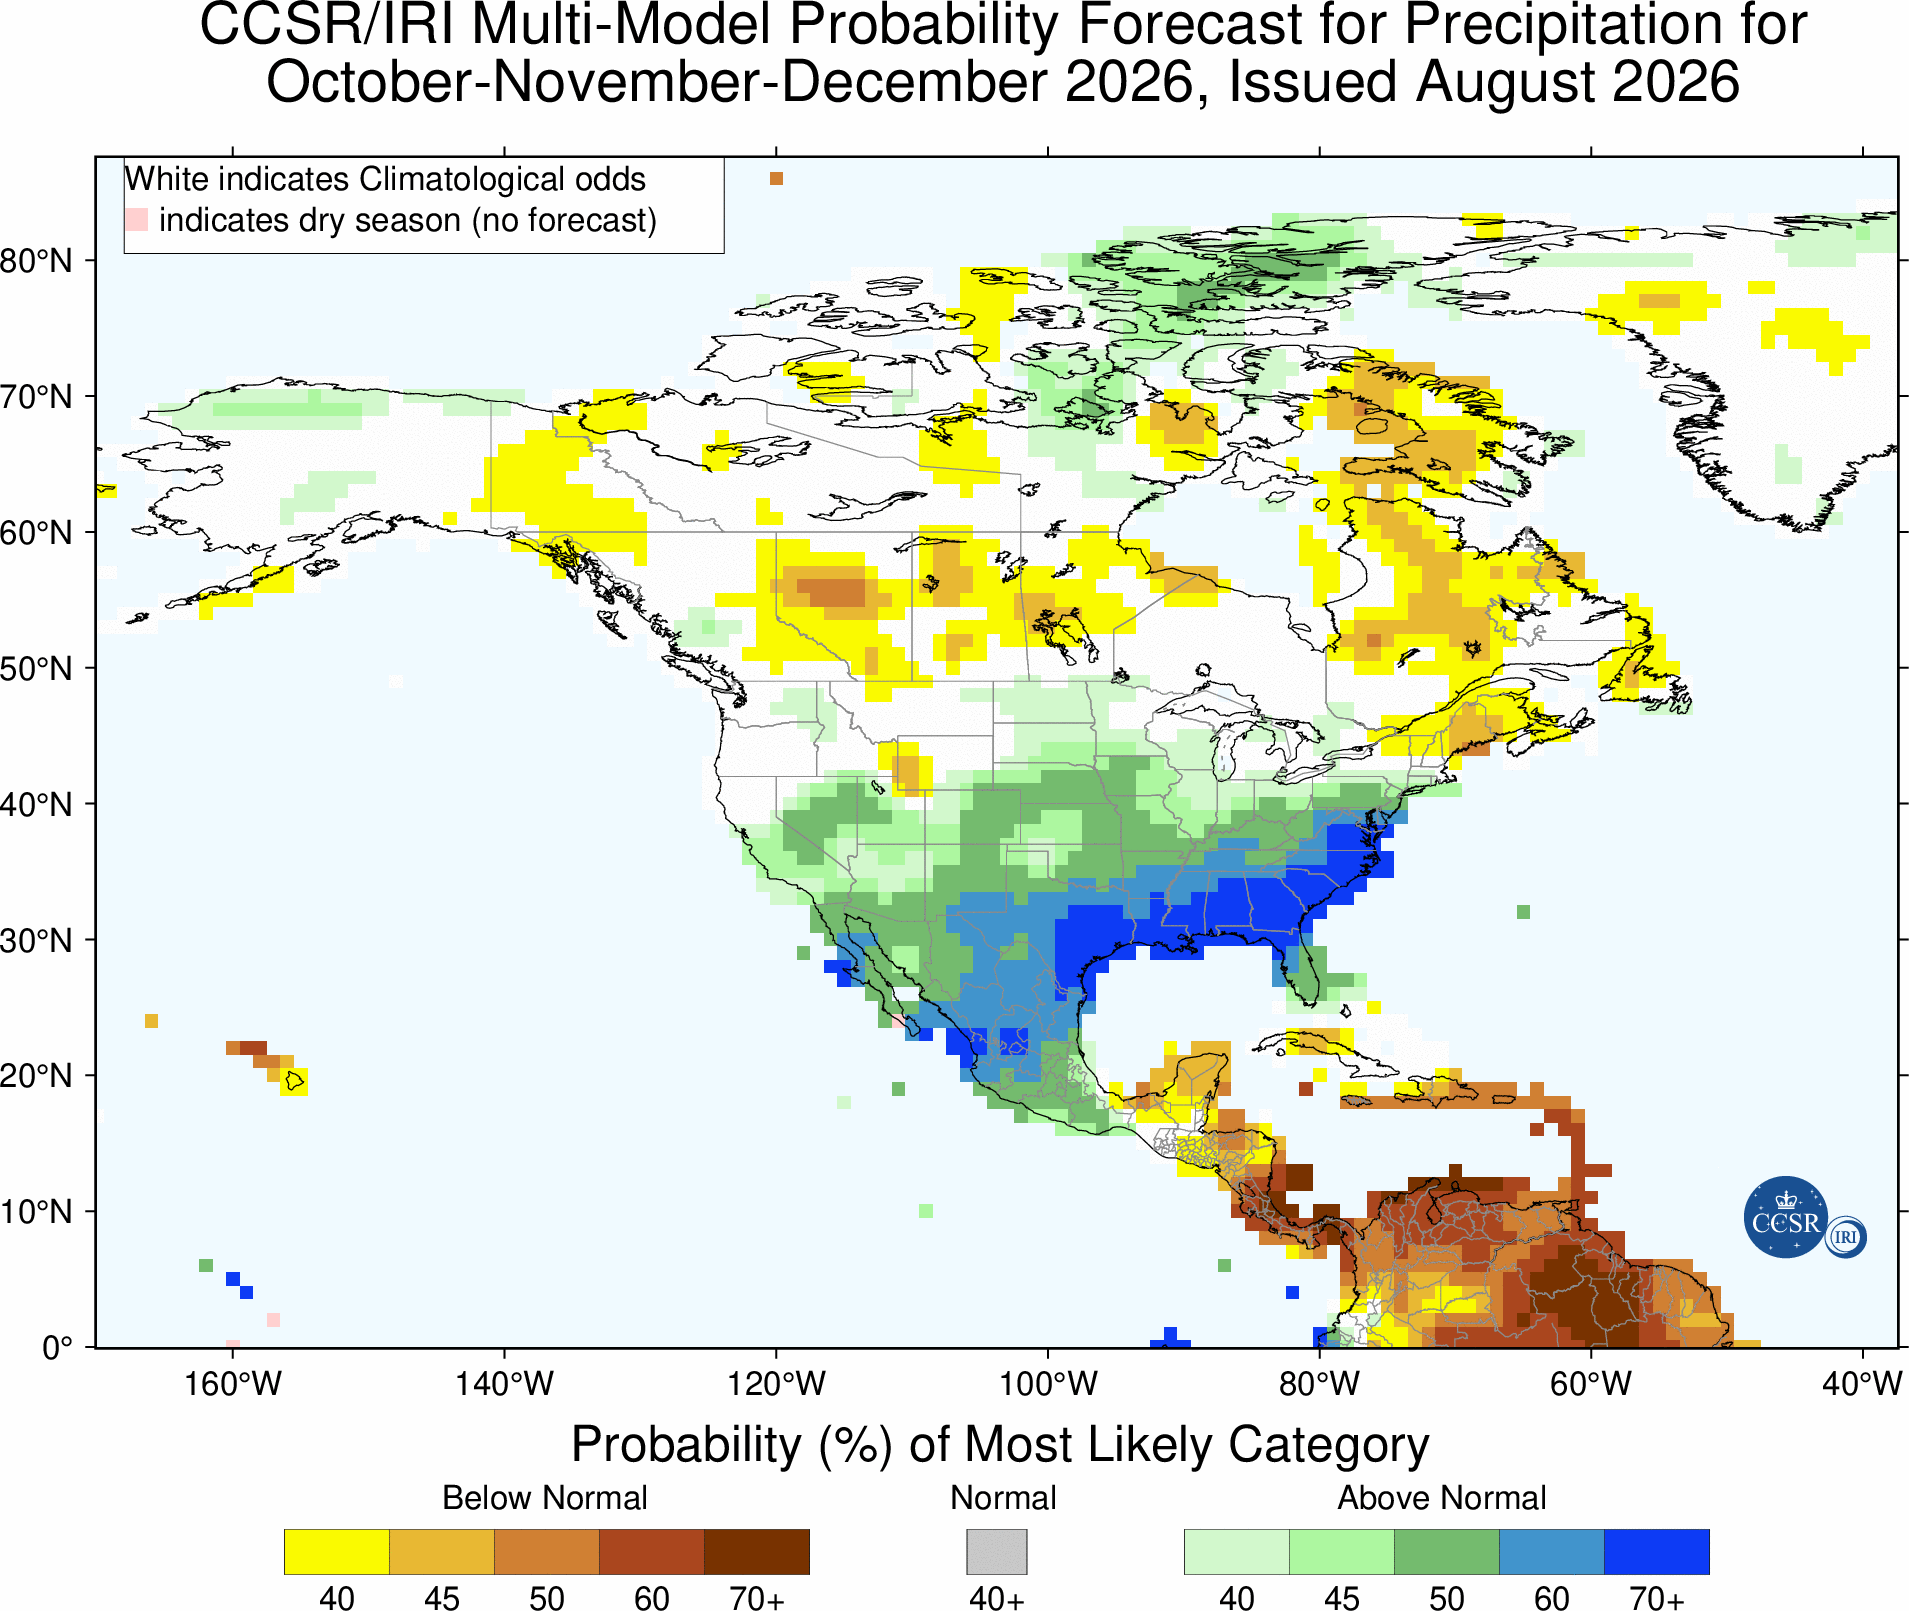
Figure 3. CCSR/IRI precipitation probability forecast for October–December 2026, showing the current outlook for precipitation across the United States.
Source: CCSR/IRI Seasonal Climate Forecasts, August 2026.
Figure 2 shows what has historically tended to happen during El Niño. Figure 3 shows how the current forecast system expects those probabilities to be expressed during October–December 2026.
The important question is not whether the forecast exactly reproduces the historical El Niño pattern. Instead, we can ask whether the 2026 forecast resembles the characteristic El Niño footprint—and where it differs.
That comparison provides both historical context and a forward-looking estimate of what may lie ahead.
A very strong El Niño does not mean extreme weather everywhere
This is perhaps the most important message.
A stronger El Niño can exert stronger forcing on the atmosphere, increasing the potential for pronounced climate responses. But event strength alone does not determine where impacts occur or how severe they will be.
What should we watch this fall?
The evolution through October–December will be critical. Scientists will be watching whether the exceptional Pacific warming persists, how tropical convection responds, and how the jet stream and storm tracks evolve across North America.
Those developments will help determine where the strongest temperature and precipitation signals emerge during fall 2026.
The bottom line
The 2026 El Niño is unusually strong, rapidly intensifying, and expected to remain a major climate signal during fall 2026. The historical record shows that El Niño can substantially shift U.S. precipitation probabilities, while current forecasts suggest that several characteristic tendencies may again emerge during October–December.
But El Niño is not a deterministic weather forecast.